Every decade or so, economists and analysts start talking about the yield curve. As jargon goes, yield curve is one of the worst offenders. However, when you look closely at how interest rates work, it’s easy to understand why the yield curve is important, and why many traders and investors use it as part of their economic and market forecasts.
What is the yield curve?
Let’s look briefly at how various interest rates are determined.
Banks must have a certain amount of cash on hand each night, per regulators. Since banks don’t earn money on cash reserves, they usually try to keep as close to the minimum requirement as possible. Sometimes, they might fall short of the required reserve level. In that case, banks make overnight loans to each other. The rate they charge on these loans is set by the Federal Reserve and is known as the Federal funds rate (or Fed funds rate). When the Fed raises or cuts the target for the Fed funds rate, it has ripple effects throughout the economy. For instance, the cost to borrow money goes up. Economists can monitor these changes via the yield curve.
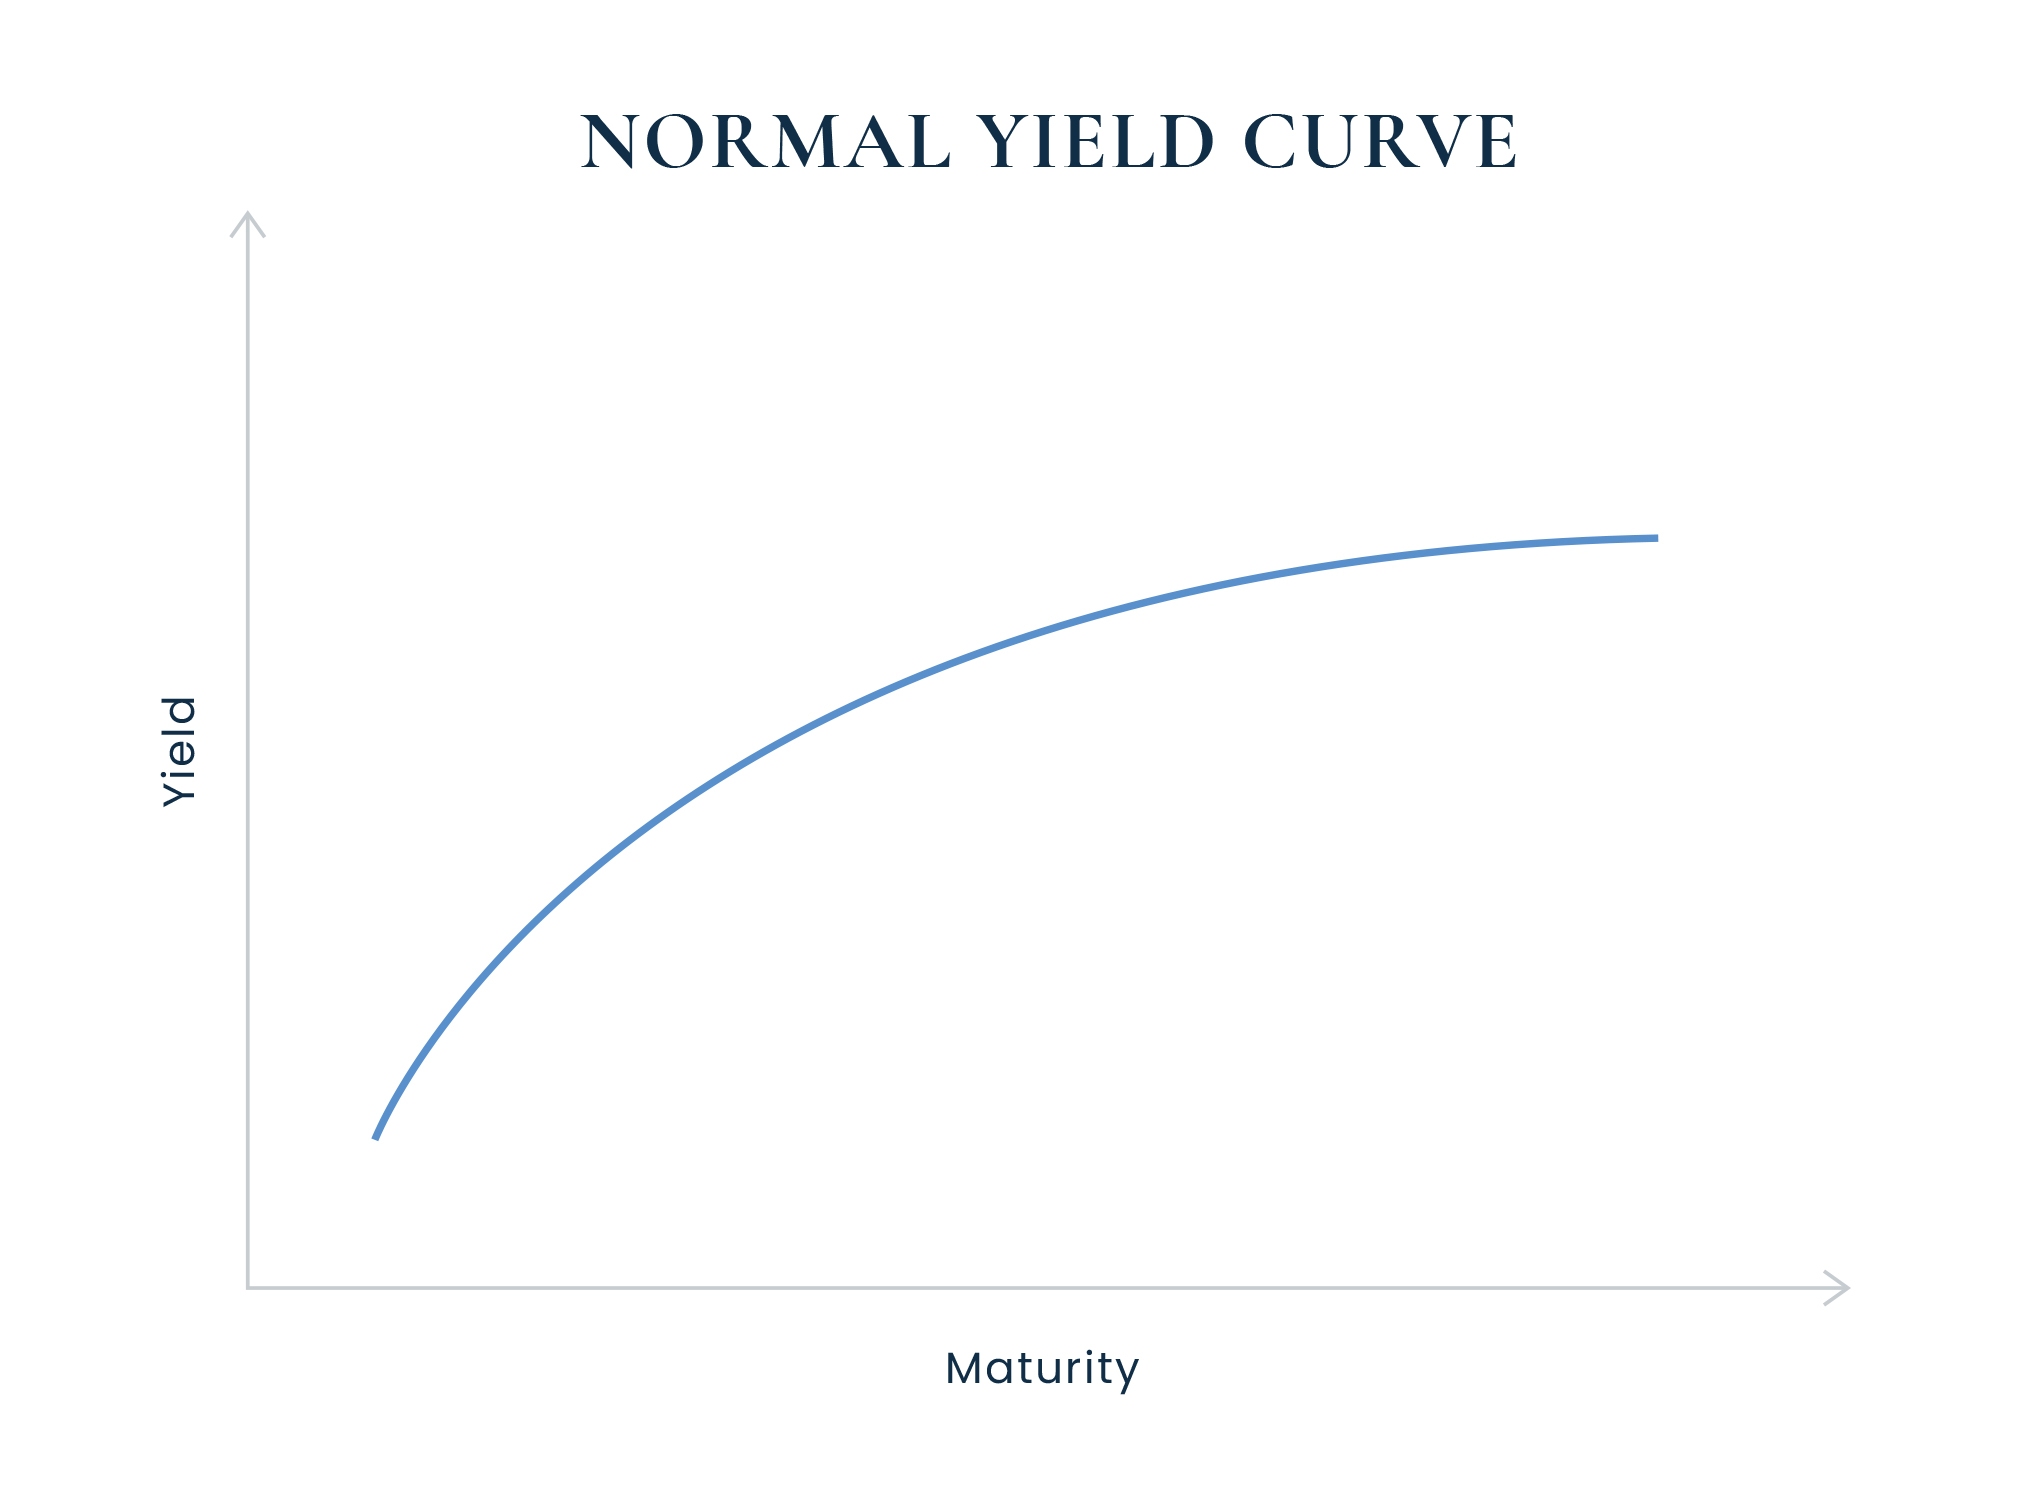
Yield refers to the interest paid on a bond. The yield curve is a graph with the daily yields of U.S. Treasury securities plotted by maturity. The slope of the curve represents the difference between yields on short-dated bonds and long-dated bonds.
Normally, it curves upward as investors demand higher yields on longer-term debt. Bonds are similar to consumer loans in this regard—a 30-year fixed-rate mortgage tends to come with a higher interest rate than a 15-year fixed-rate mortgage, all-else equal.
A normal yield curve suggests that investors expect stronger growth in the future, which tends to imply some degree of inflation expectations, and thus, higher rates on long-term debt. A classic yield curve looks like this:

Why the Yield Curve Matters
When we talk about the yield curve, we’re referring specifically to the yield on U.S. Treasuries, but this curve parallels other areas of the economy. In other words, the yield curve matters to both your investment portfolio and your personal finances.
The yield curve can also tell you how economists, traders, and issuers are thinking about the outlook for markets and the overall economy. When the Fed hikes rates, or when rates are high and folks expect they’ll come down in the future, the yield curve tends to flatten or invert. And that’s an indicator worth watching.
Inverted Yield Curves
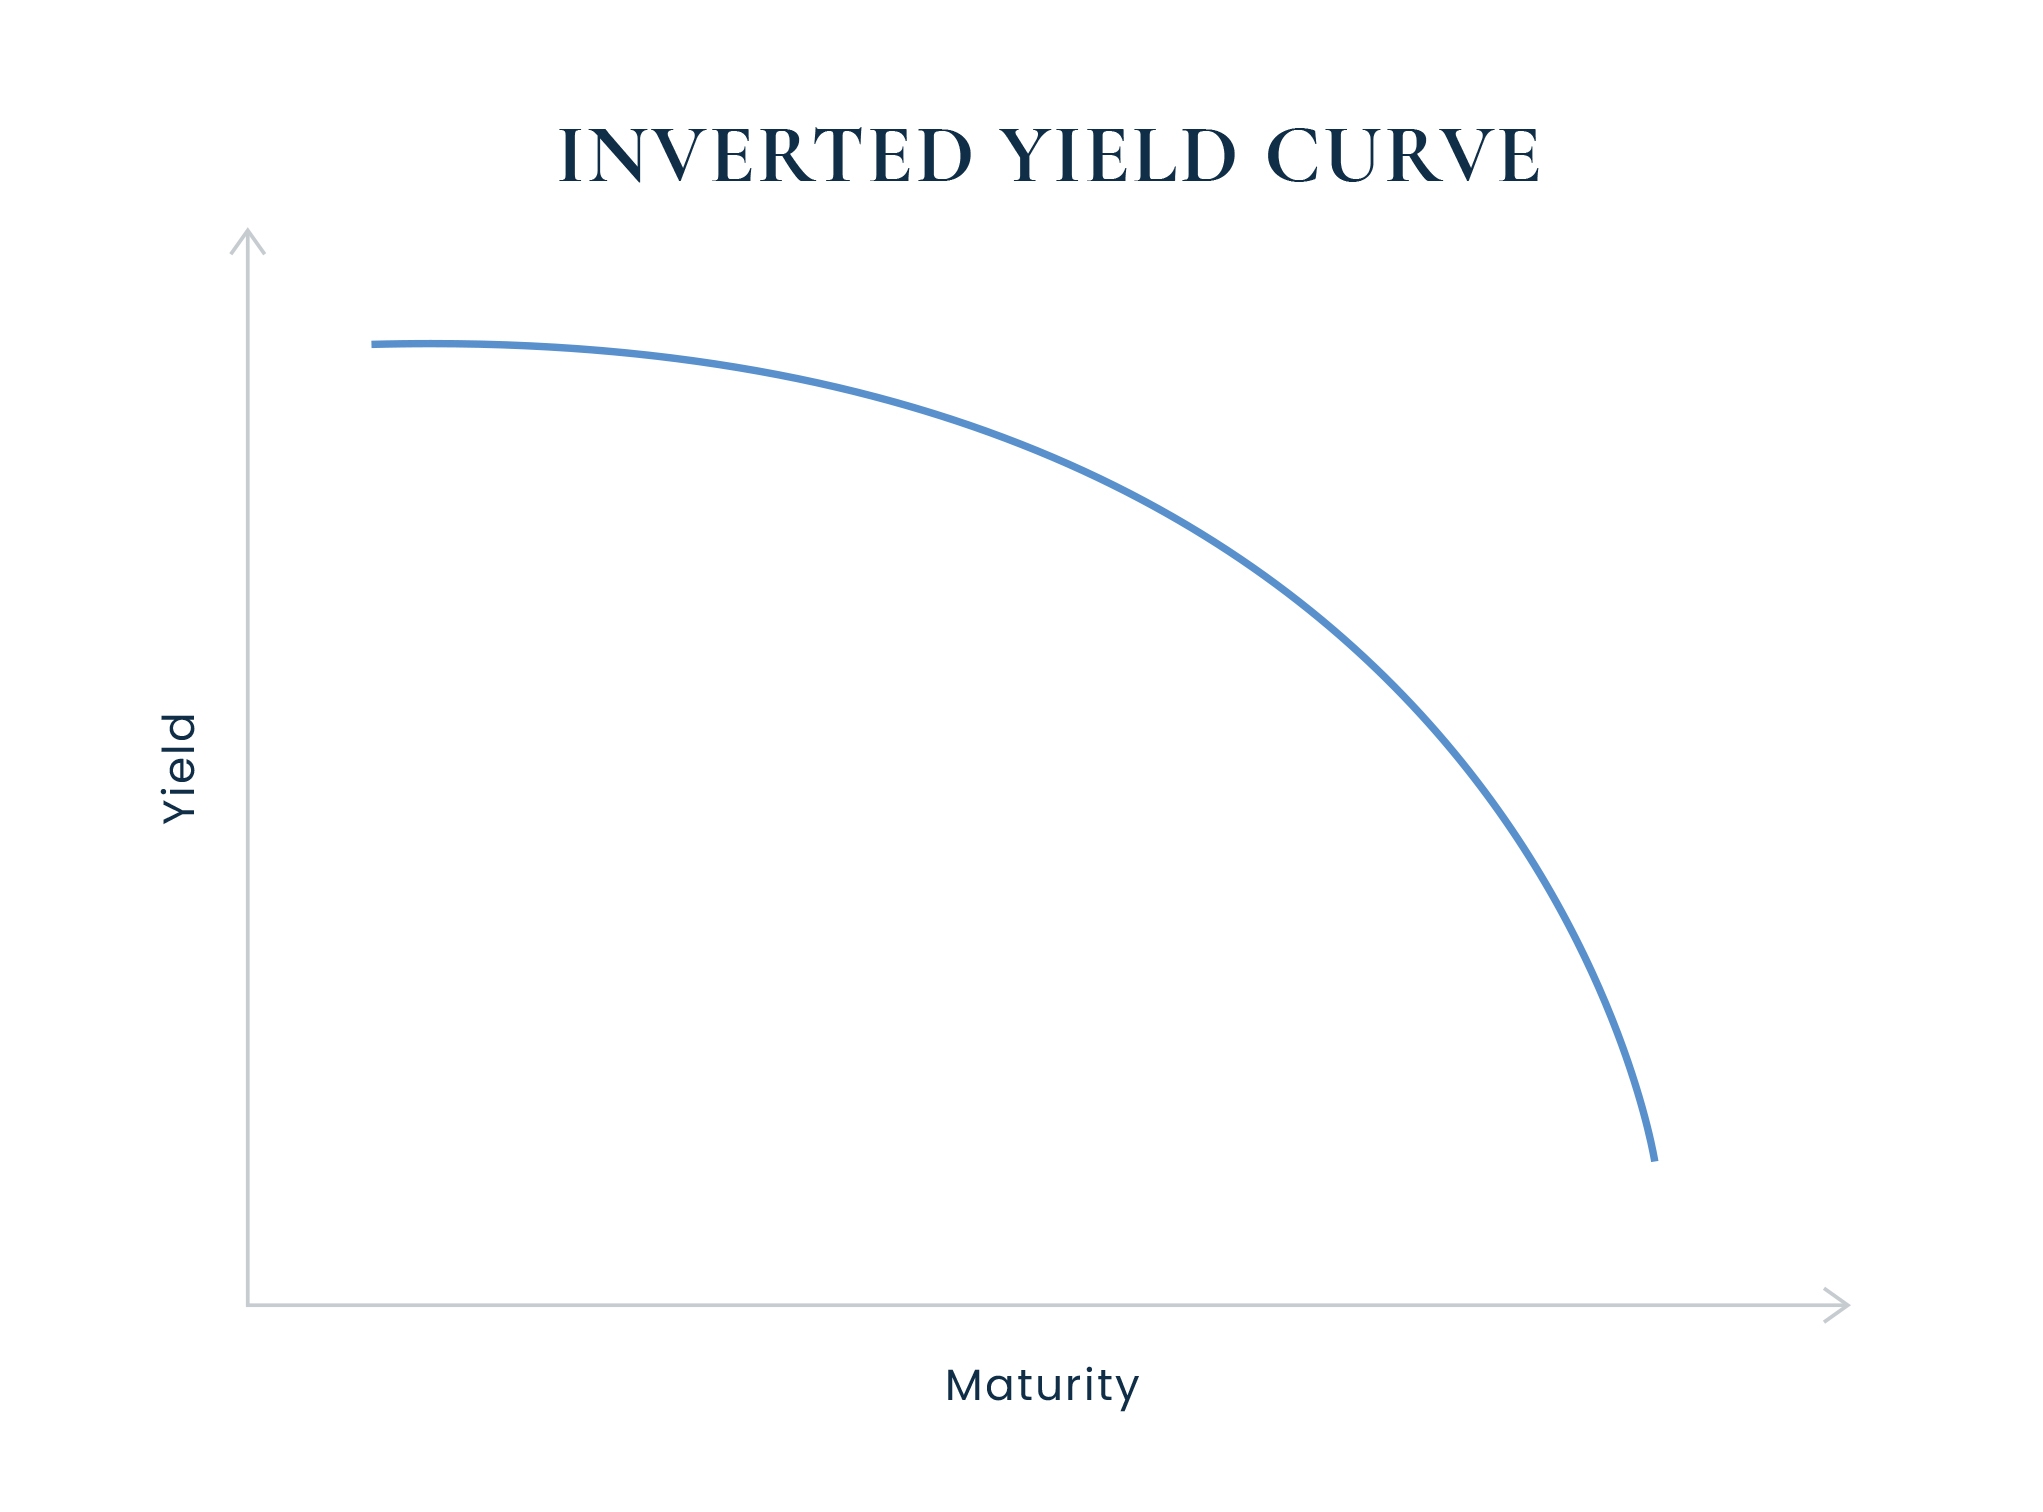
A rapid series of rate hikes by the Fed can create an Inverted yield curve, or a situation where the market interest rate on short-term debt moves higher than those on longer-term debt.
This happens in part because monetary officials are increasing their benchmark rate (which lifts short-end market rates accordingly). At the same time, the other part is that investors may start demanding more longer-term debt. They do this because Treasury bonds (those with maturity dates further out) are commonly viewed as the safety play during times of economic and market uncertainty. Hence, to their demand means higher prices and lower yields on long-term bonds.
The specific changes to the yield curve, including how steep the inverted curve is, often reflect investor sentiment. If traders and issuers think that interest rates are going to come down in the future, they likely don’t want to be locked into paying today’s higher rates far into the future.
An inverted yield curve looks like this:

The Yield Curve as an Indicator
An inverted yield curve tends to signal economic trouble ahead. In fact, an inversion of two-year and 10-year Treasury notes occurred before each recession over the past 50 years, with only one “false positive” in that time.
So, while an inverted yield curve does not indicate when a recession might happen or how severe it will be, it tends to reliably predict economic challenges.
Consider this: The yield curve inverted in 2006, a full three years before the economy officially entered a recession in 2009, in the wake of the financial crisis. Another significant yield curve inversion? The late 1970s when Paul Volcker’s Fed raised rates aggressively to combat inflation. In early 2023, the yield curve was more inverted than it was during Volcker’s tenure.
The Yield Curve and Your Finances
How do changes to the yield curve affect investment performance and your financial plan? The yield curve can help us with economic outlook as well as how we allocate a client’s portfolio to manage inflation and interest-rate risk.
The yield curve may also help us spot opportunity.
When the yield curve inverts, we may transition some client assets to cash equivalents or short-term bonds to take advantage of higher returns. We may also shift money into long-term bonds to lock in rates and prepare for the future.
While it’s important to maximize these opportunities, our primary focus remains our clients’ long-term goals—time in the market is almost always more influential than timing the market. If you have questions about our interest rate outlook or how changes in the yield curve might affect your portfolio, set up a time to discuss.


